5 tips to measure adoption in Office 365
Office 365 can provide better collaboration, connectedness and structure within your organization. When choosing cloud solutions within Microsoft's eco-system, you are also choosing daily change. Technology is changing faster and faster, and just as well.
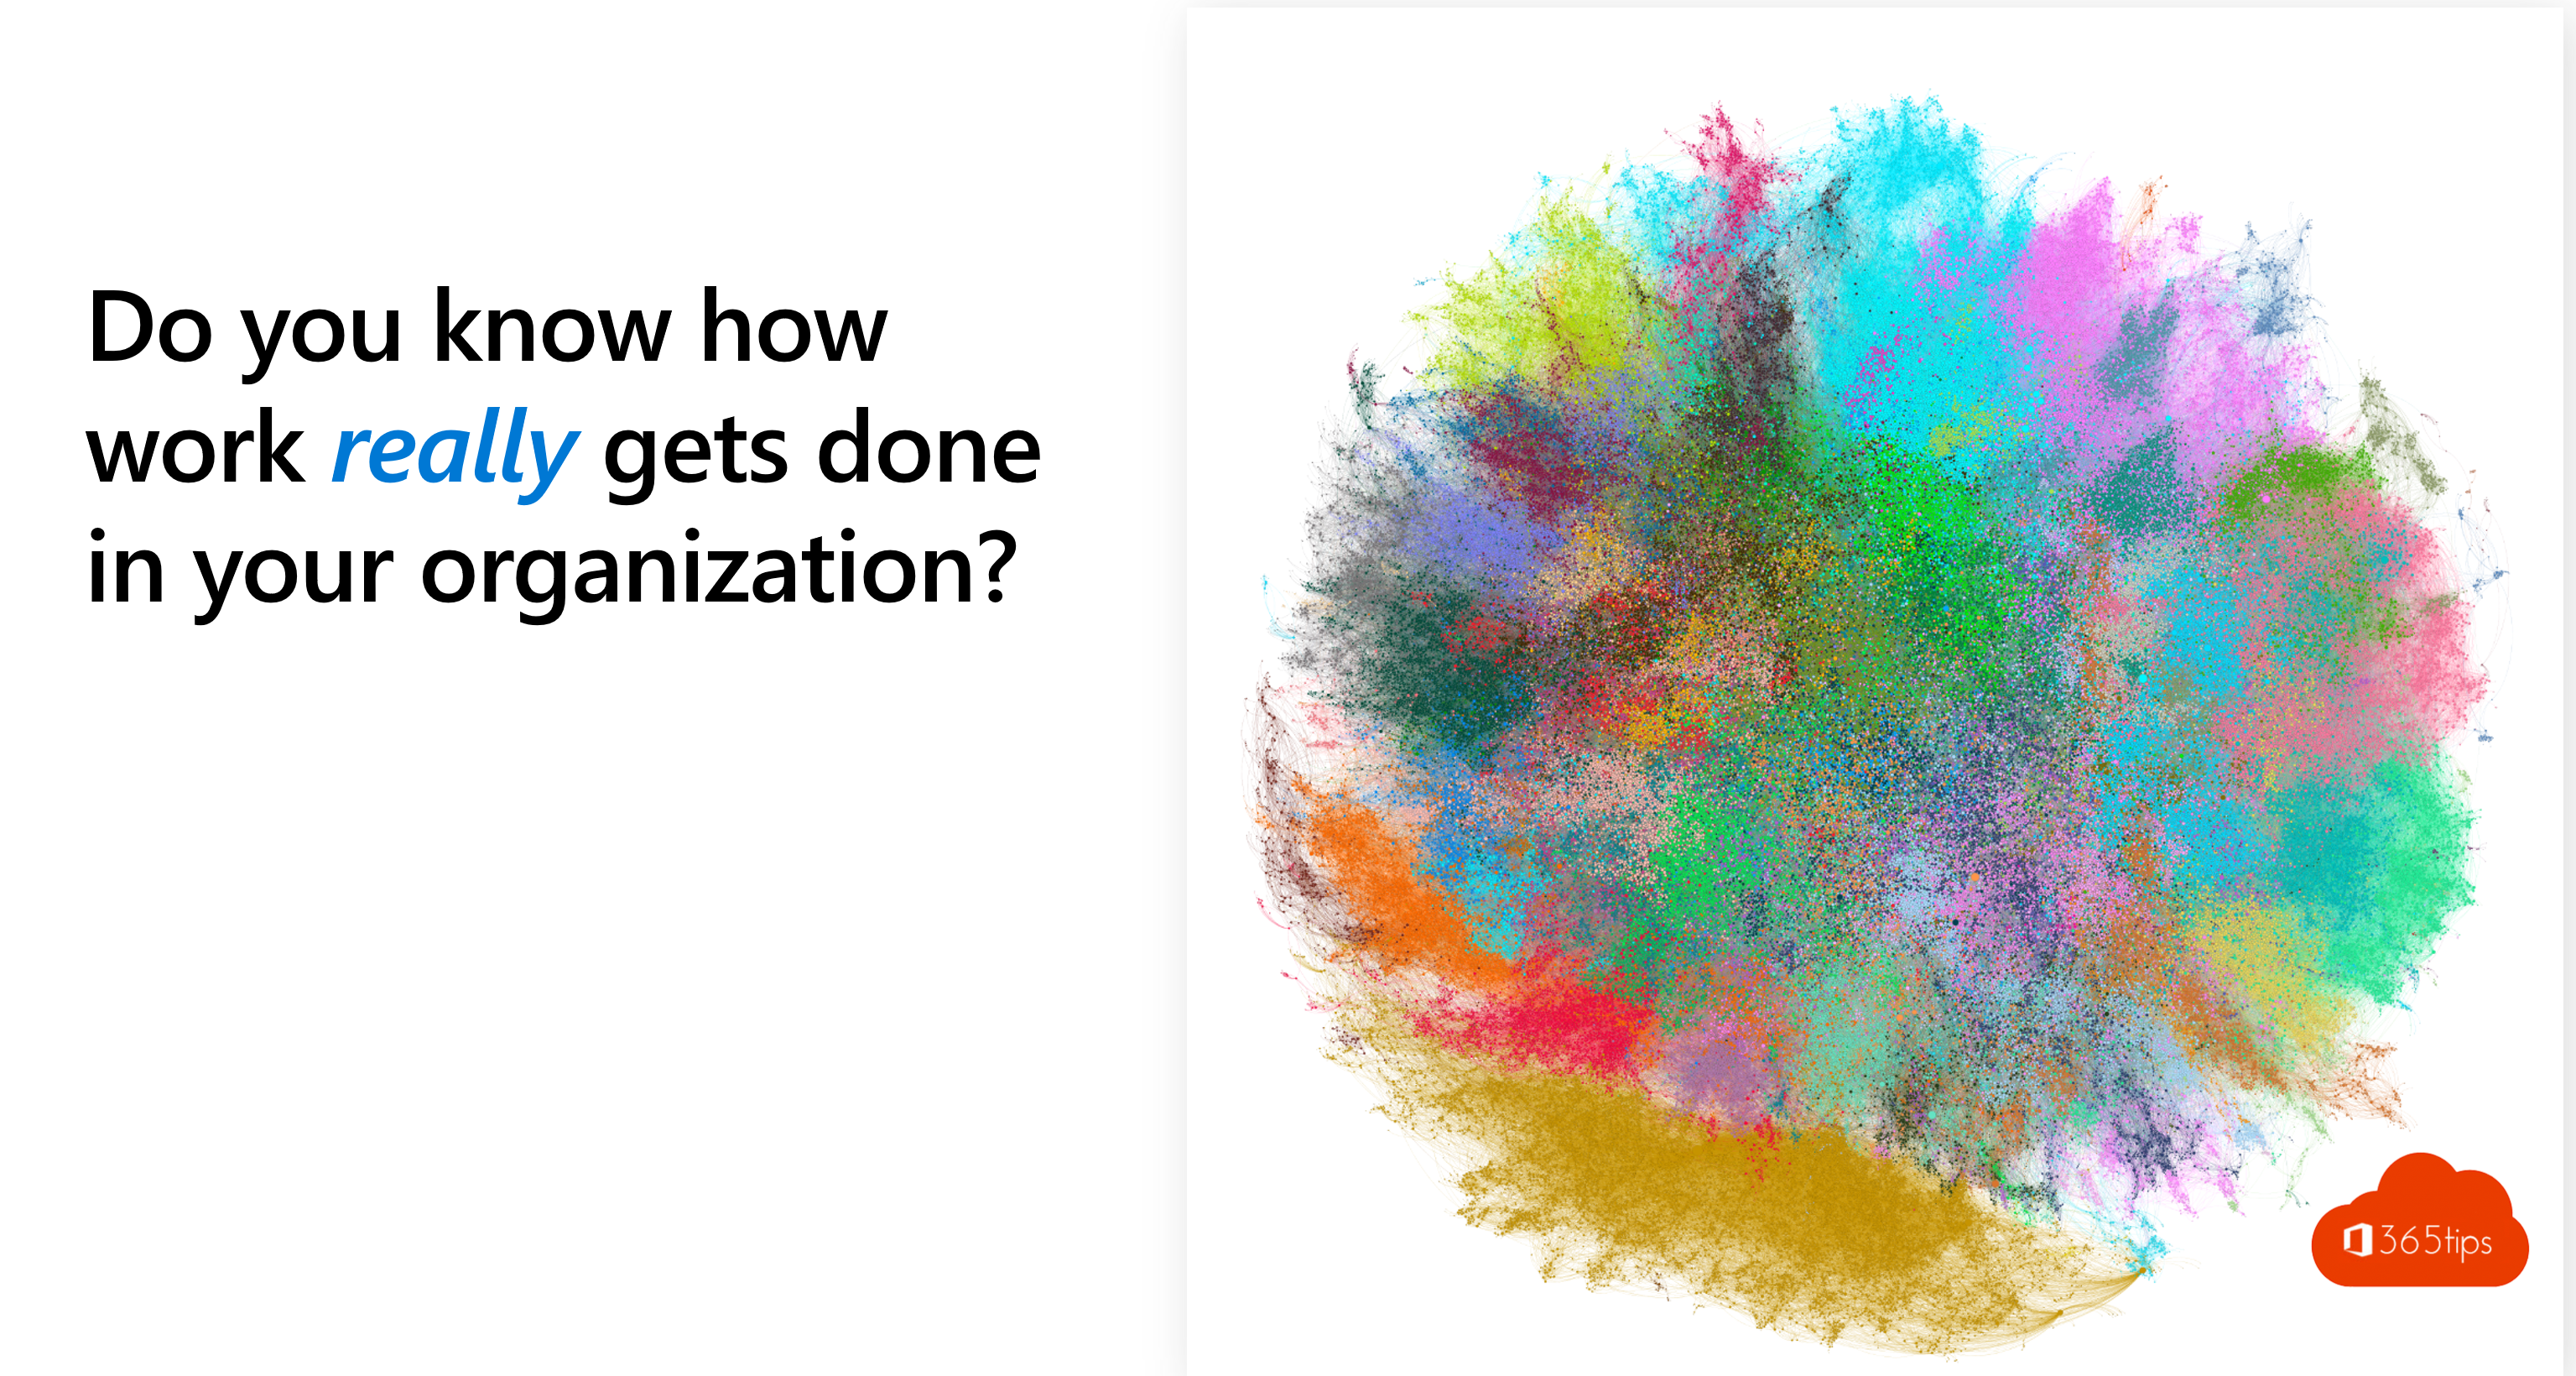
To properly anticipate change, you want to be able to represent facts in reports. You want to create insights by making inquiries inside and outside your organization. You want to gather technical insights to see how a process is going. How many people are using services such as Teams, OneDrive, Outlook, SharePointPlanner, Yammer...
Technology allows us to establish facts. Facts, values, measurement points are important to test whether the effort we put into user training (for example) and guidance is necessary.
In this blog, I have written down the 5 possible places that can be used to measure user adoption within Office 365 . Also read the summary & conclusions at the bottom.
Practical examples:
- How many people use Microsoft Teams? What is the trend or evolution since the month before?
- How many people have stopped emailing and are completely reaching for Microsoft Teams?
- Can you measure the evolution as we mail less, so work more in Teams on the work-life balance.
- Meeting culture...
1. Workplace Analytics
Do you know what tasks your organization spends time on?
- How much time do we spend on specific tasks?
- How automated are we really for task A.
What is workplace analytics
Microsoft Workplace Analytics uses data from Office 365 to identify collaboration patterns that affect user productivity, effectiveness and engagement.
Strategic approach
- Analyze & identify
- Taking action & changing behavior
- Measure change
- Repeat these steps to change "better
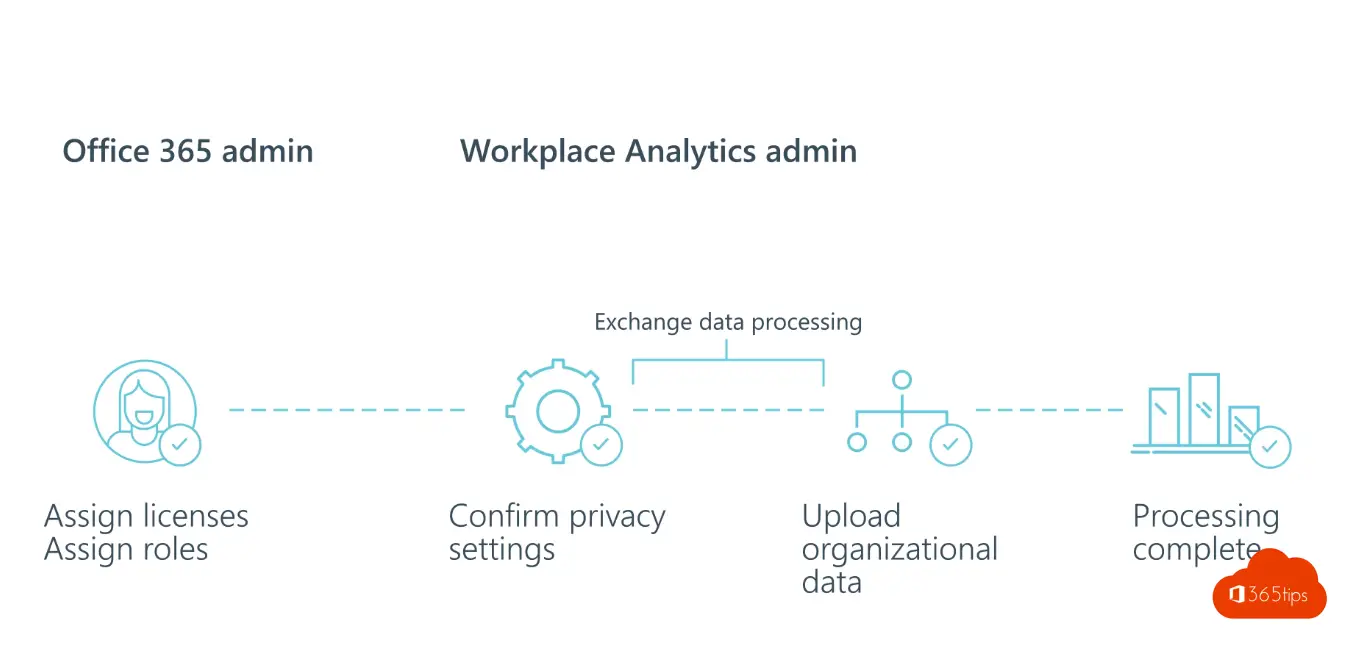
Workplace Analytics data
Workplace Analytics measures exchange content and puts it in relation to Organization content. Thanks to the insights from Exchange within Office 365, and data points within Microsoft 365, it is possible to establish relationships. Example: Email behavior.
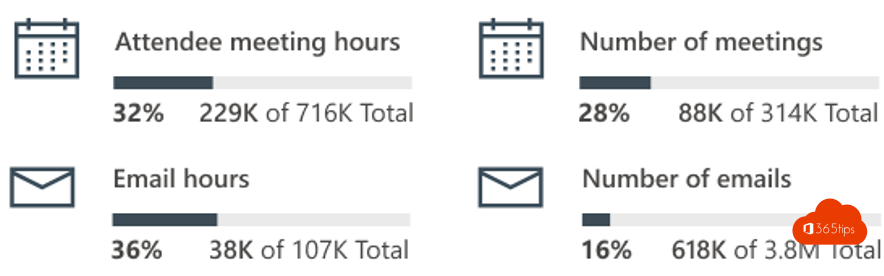
Sample presentation Microsoft Analytics
- In the overview above you can see all the "topics" on which most meetings are held.
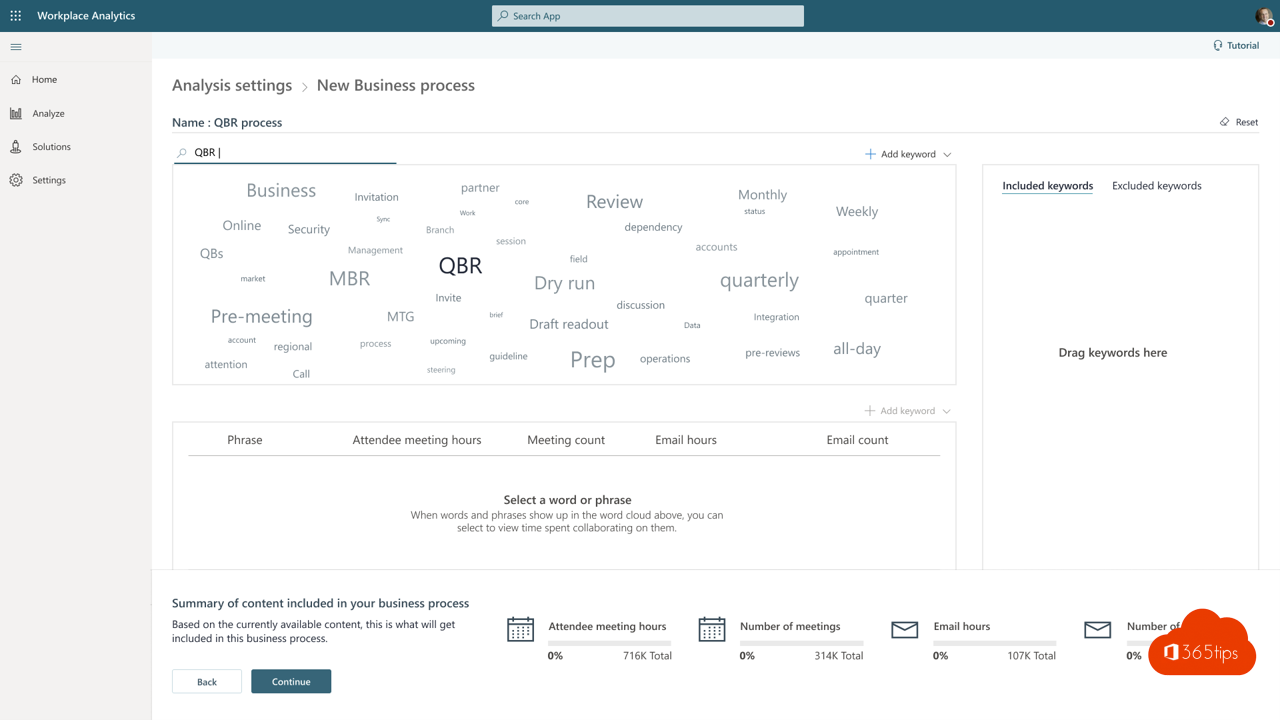
- In this show, you can see how many meetings are held for QBR.
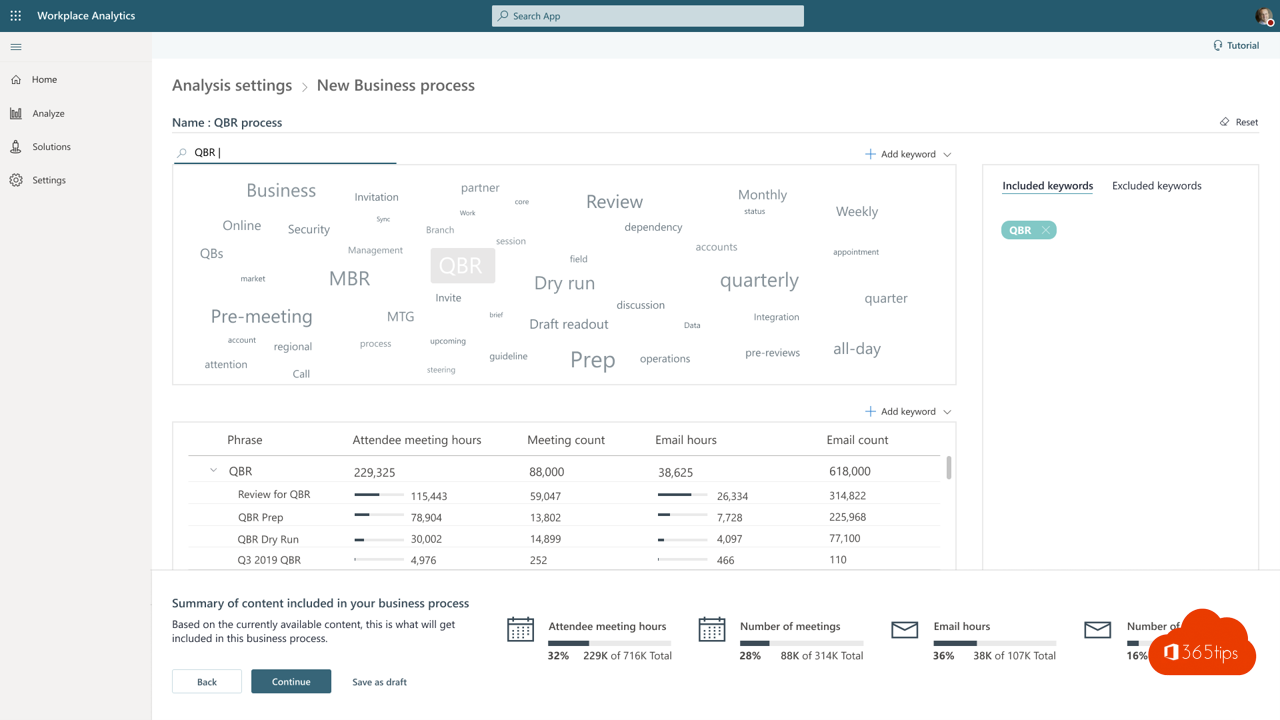
- Overview analysis of meetings.
- 32% of our time is spent in meetings.
- 36% of our hours are spent sending emails.
- ....
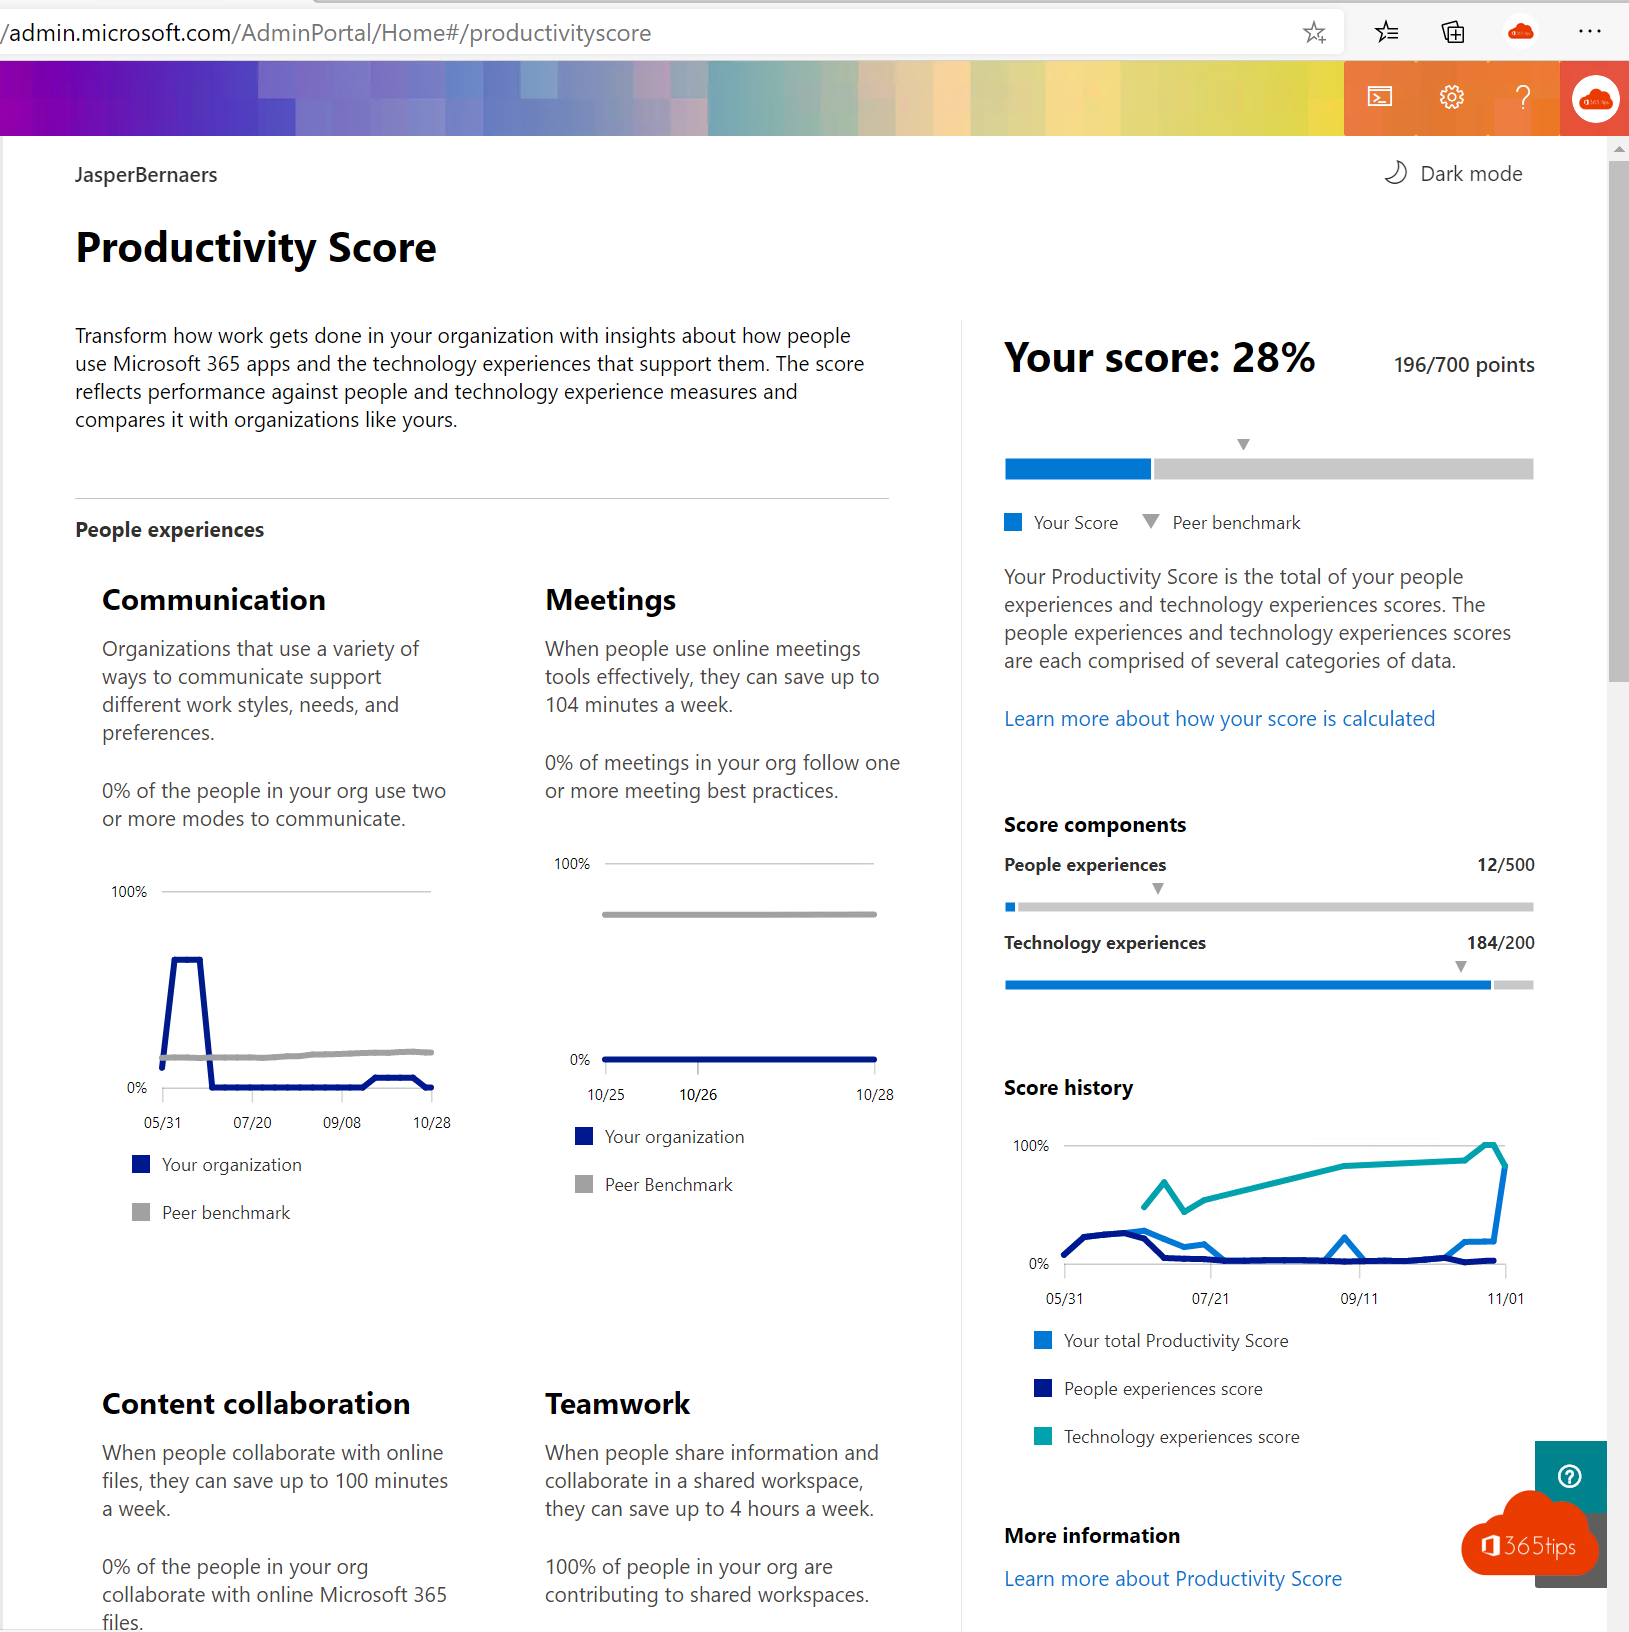
Using workplace analytics
Browse To: https://admin.microsoft.com/AdminPortal/Home#/productivityscore
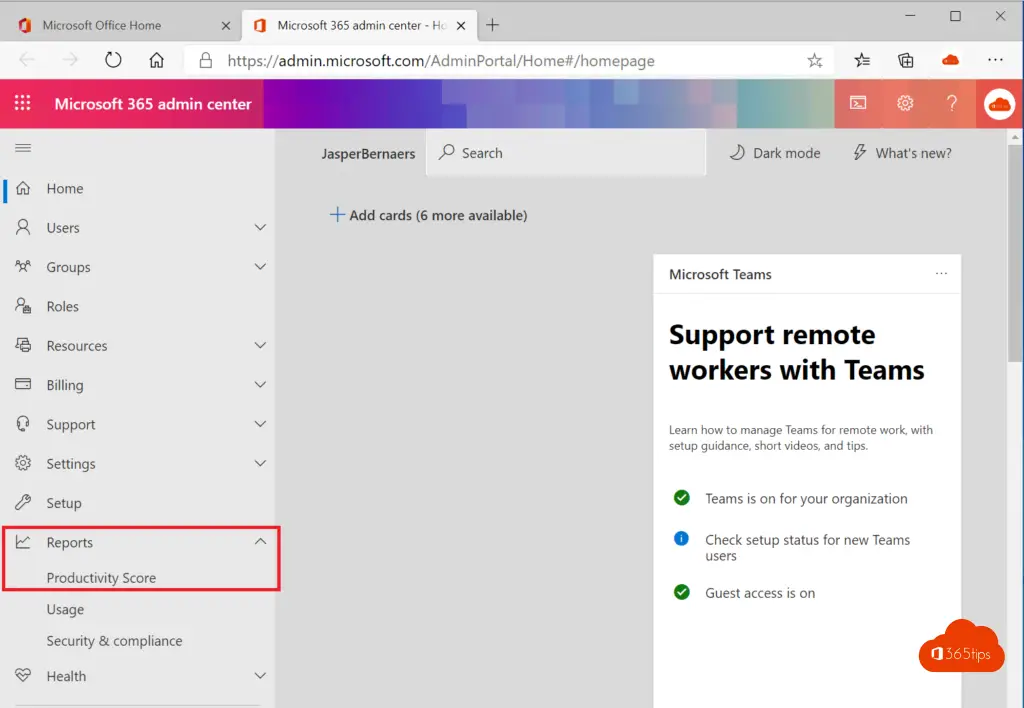
Activate the score by clicking enable. Use the revamped reports! Get started via this blog.

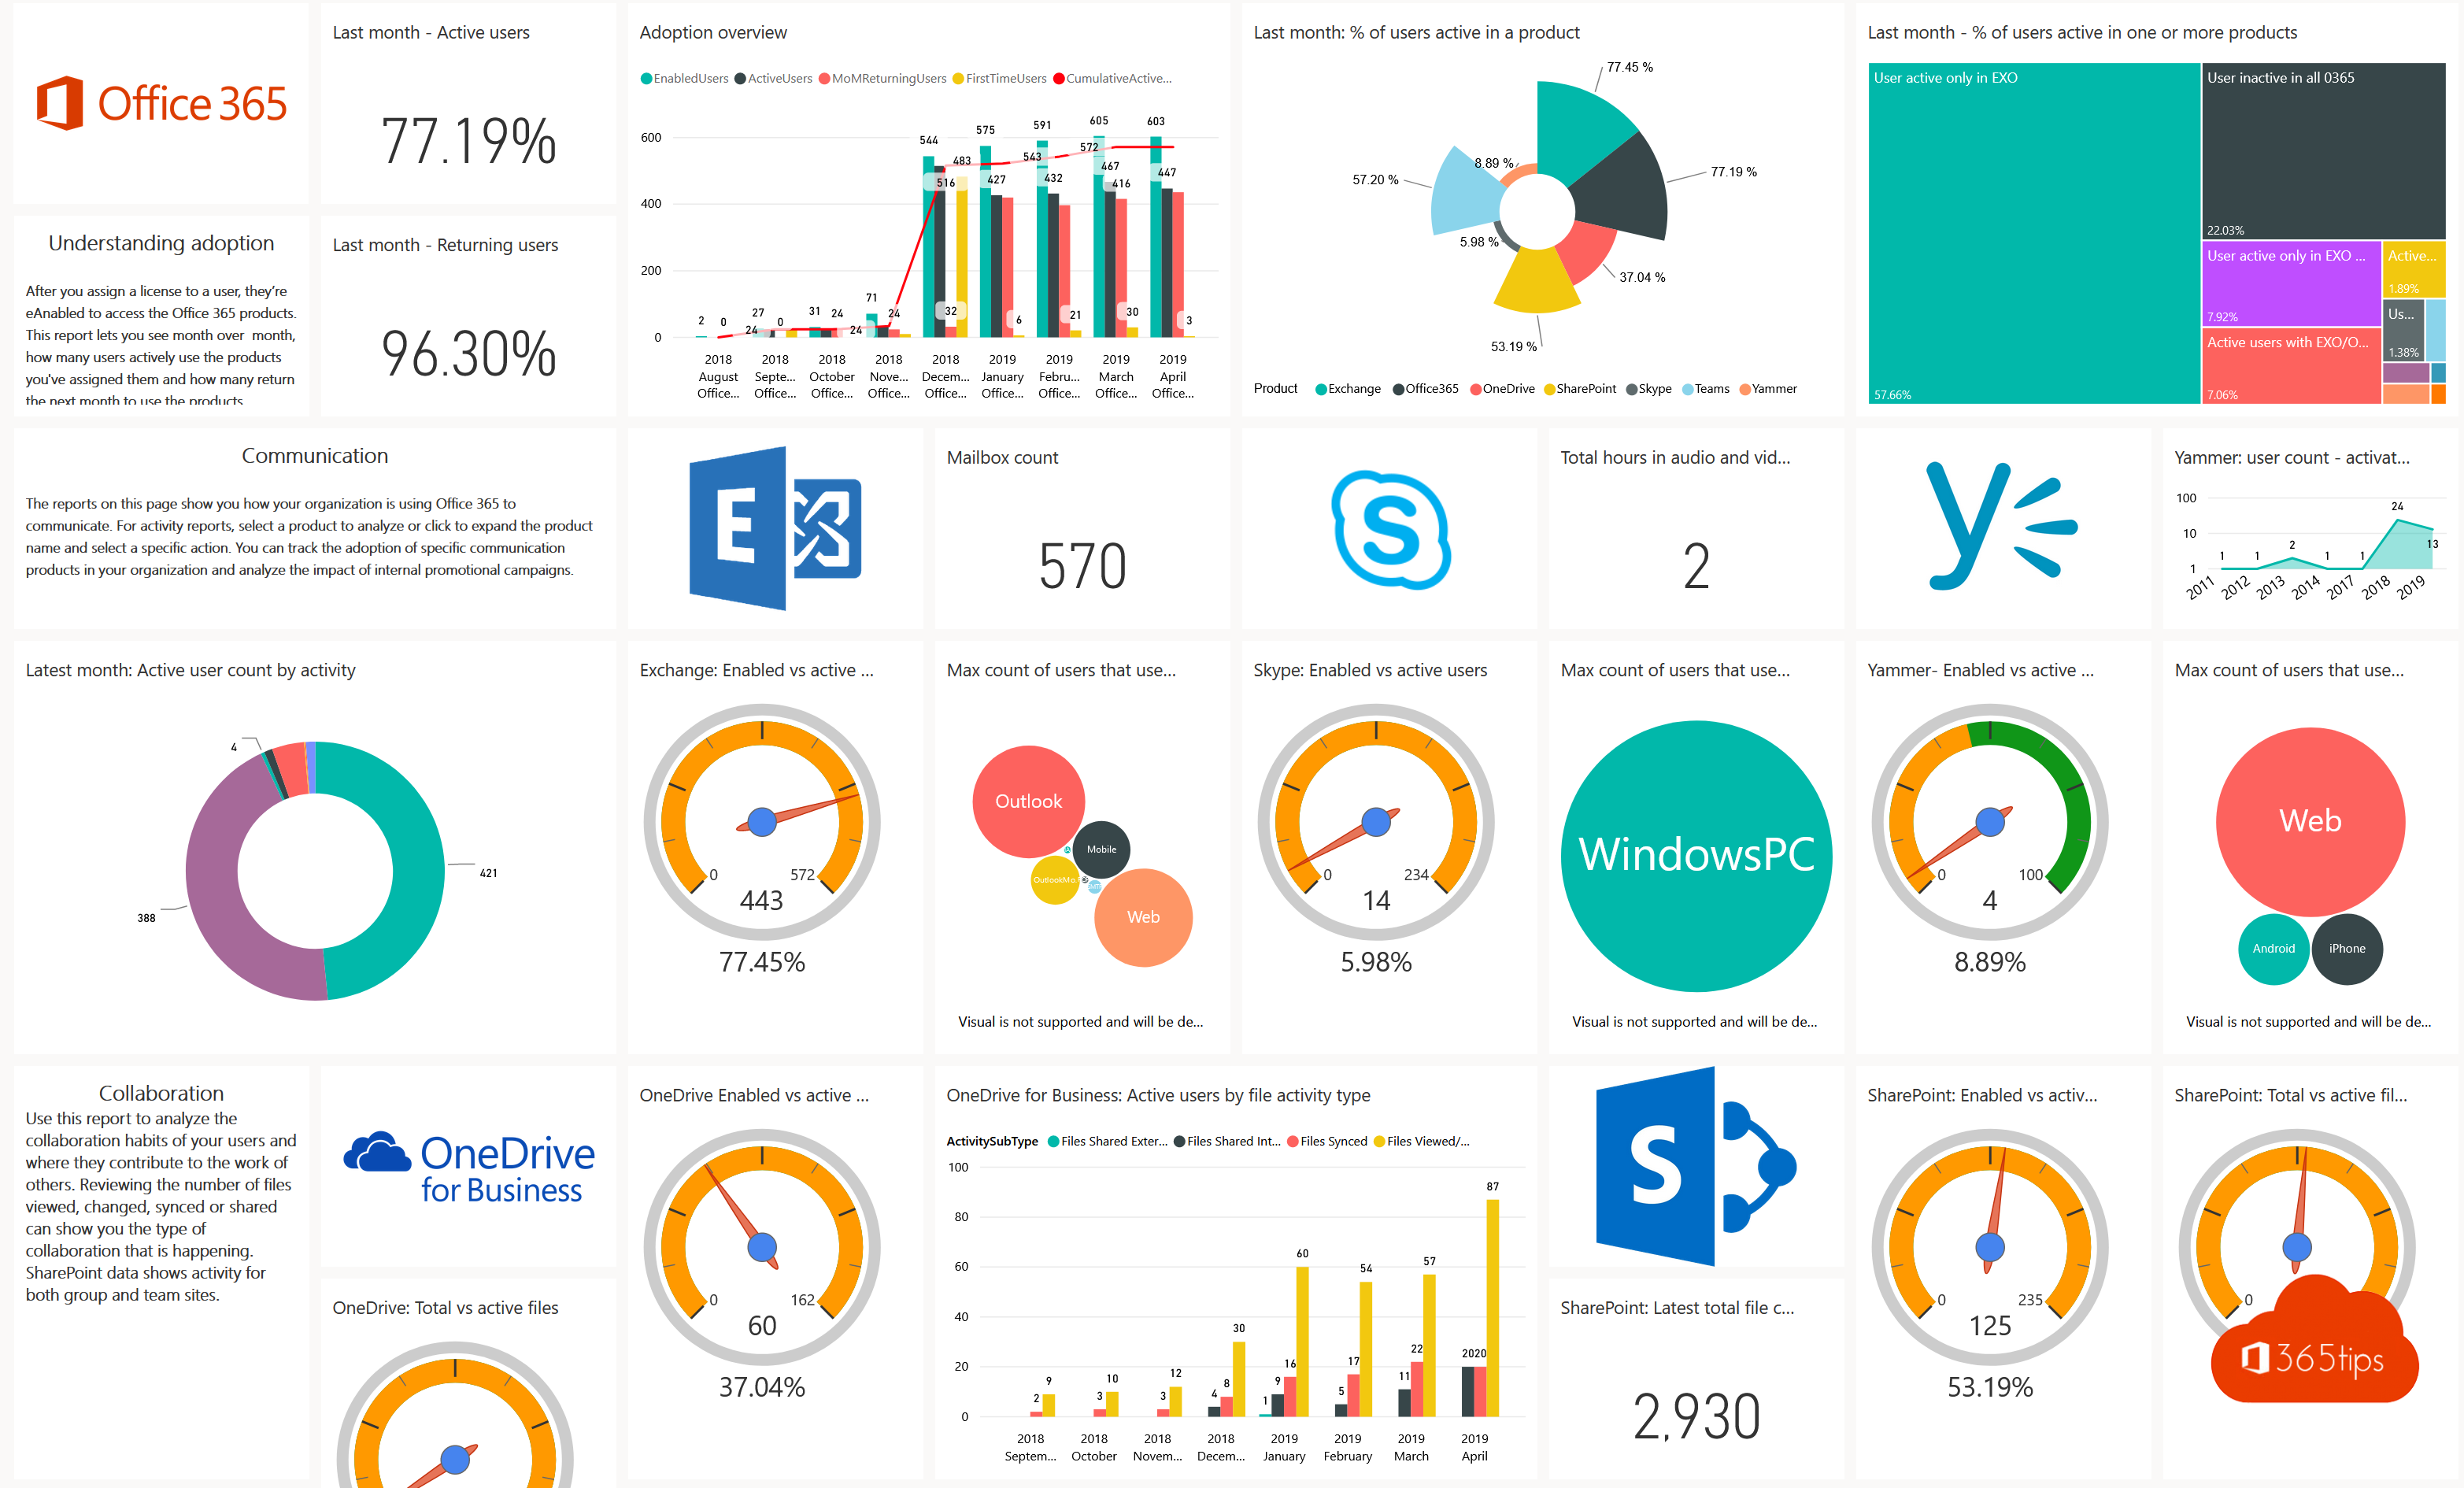
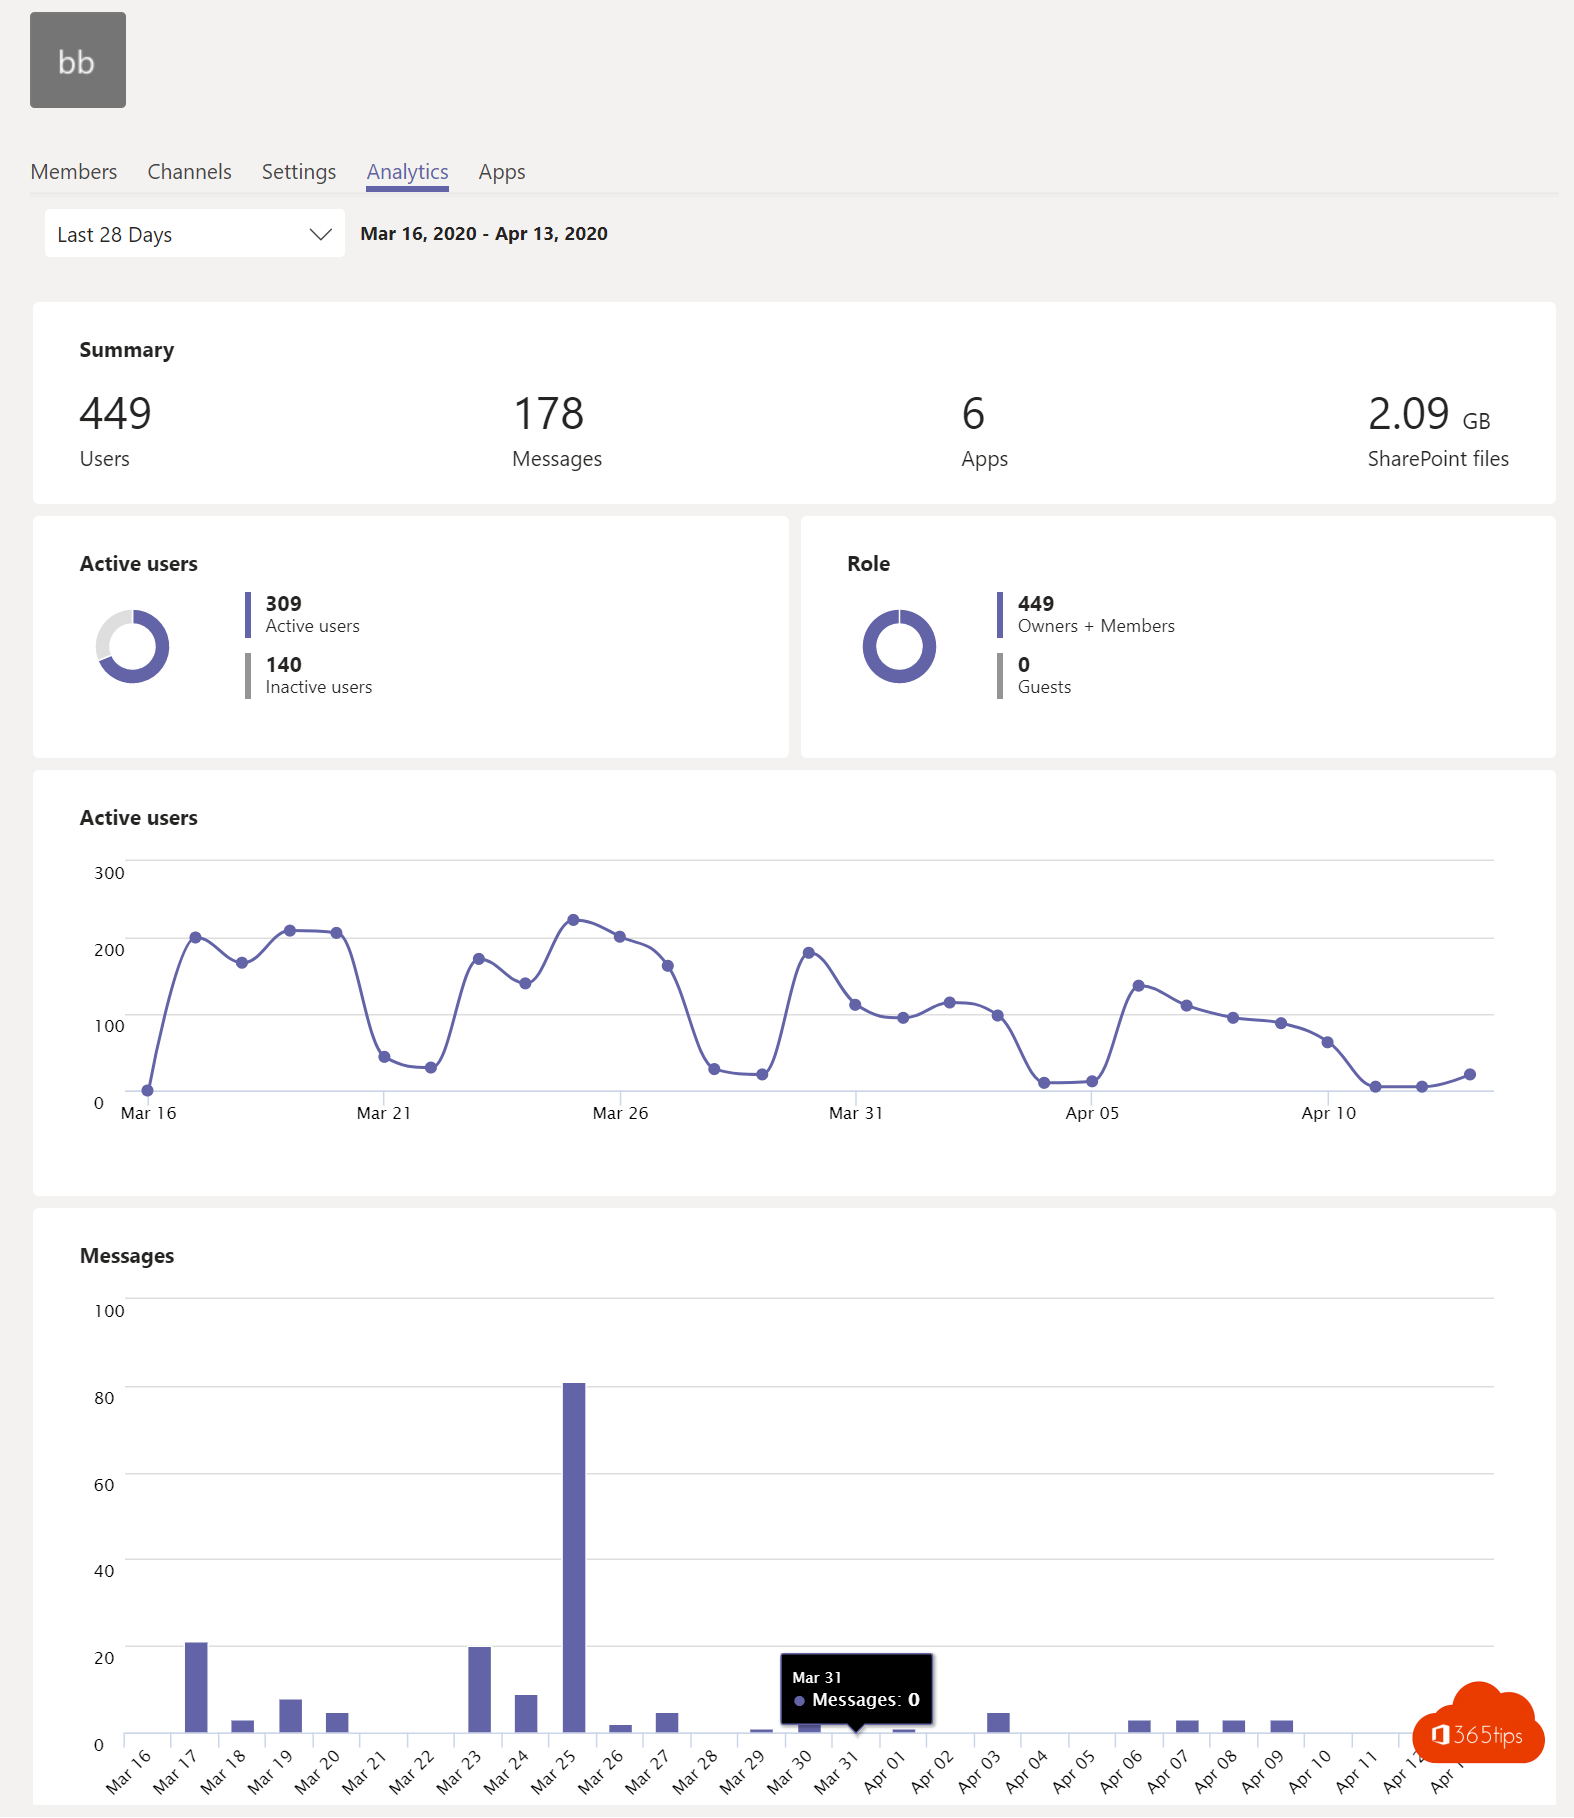
2. Office 365 Adoption dashboards
- Through Microsoft 365 Usage Analytics, this blog allows you to activate insights that are standard in every Office 365 tenant present.
High level - executive summary
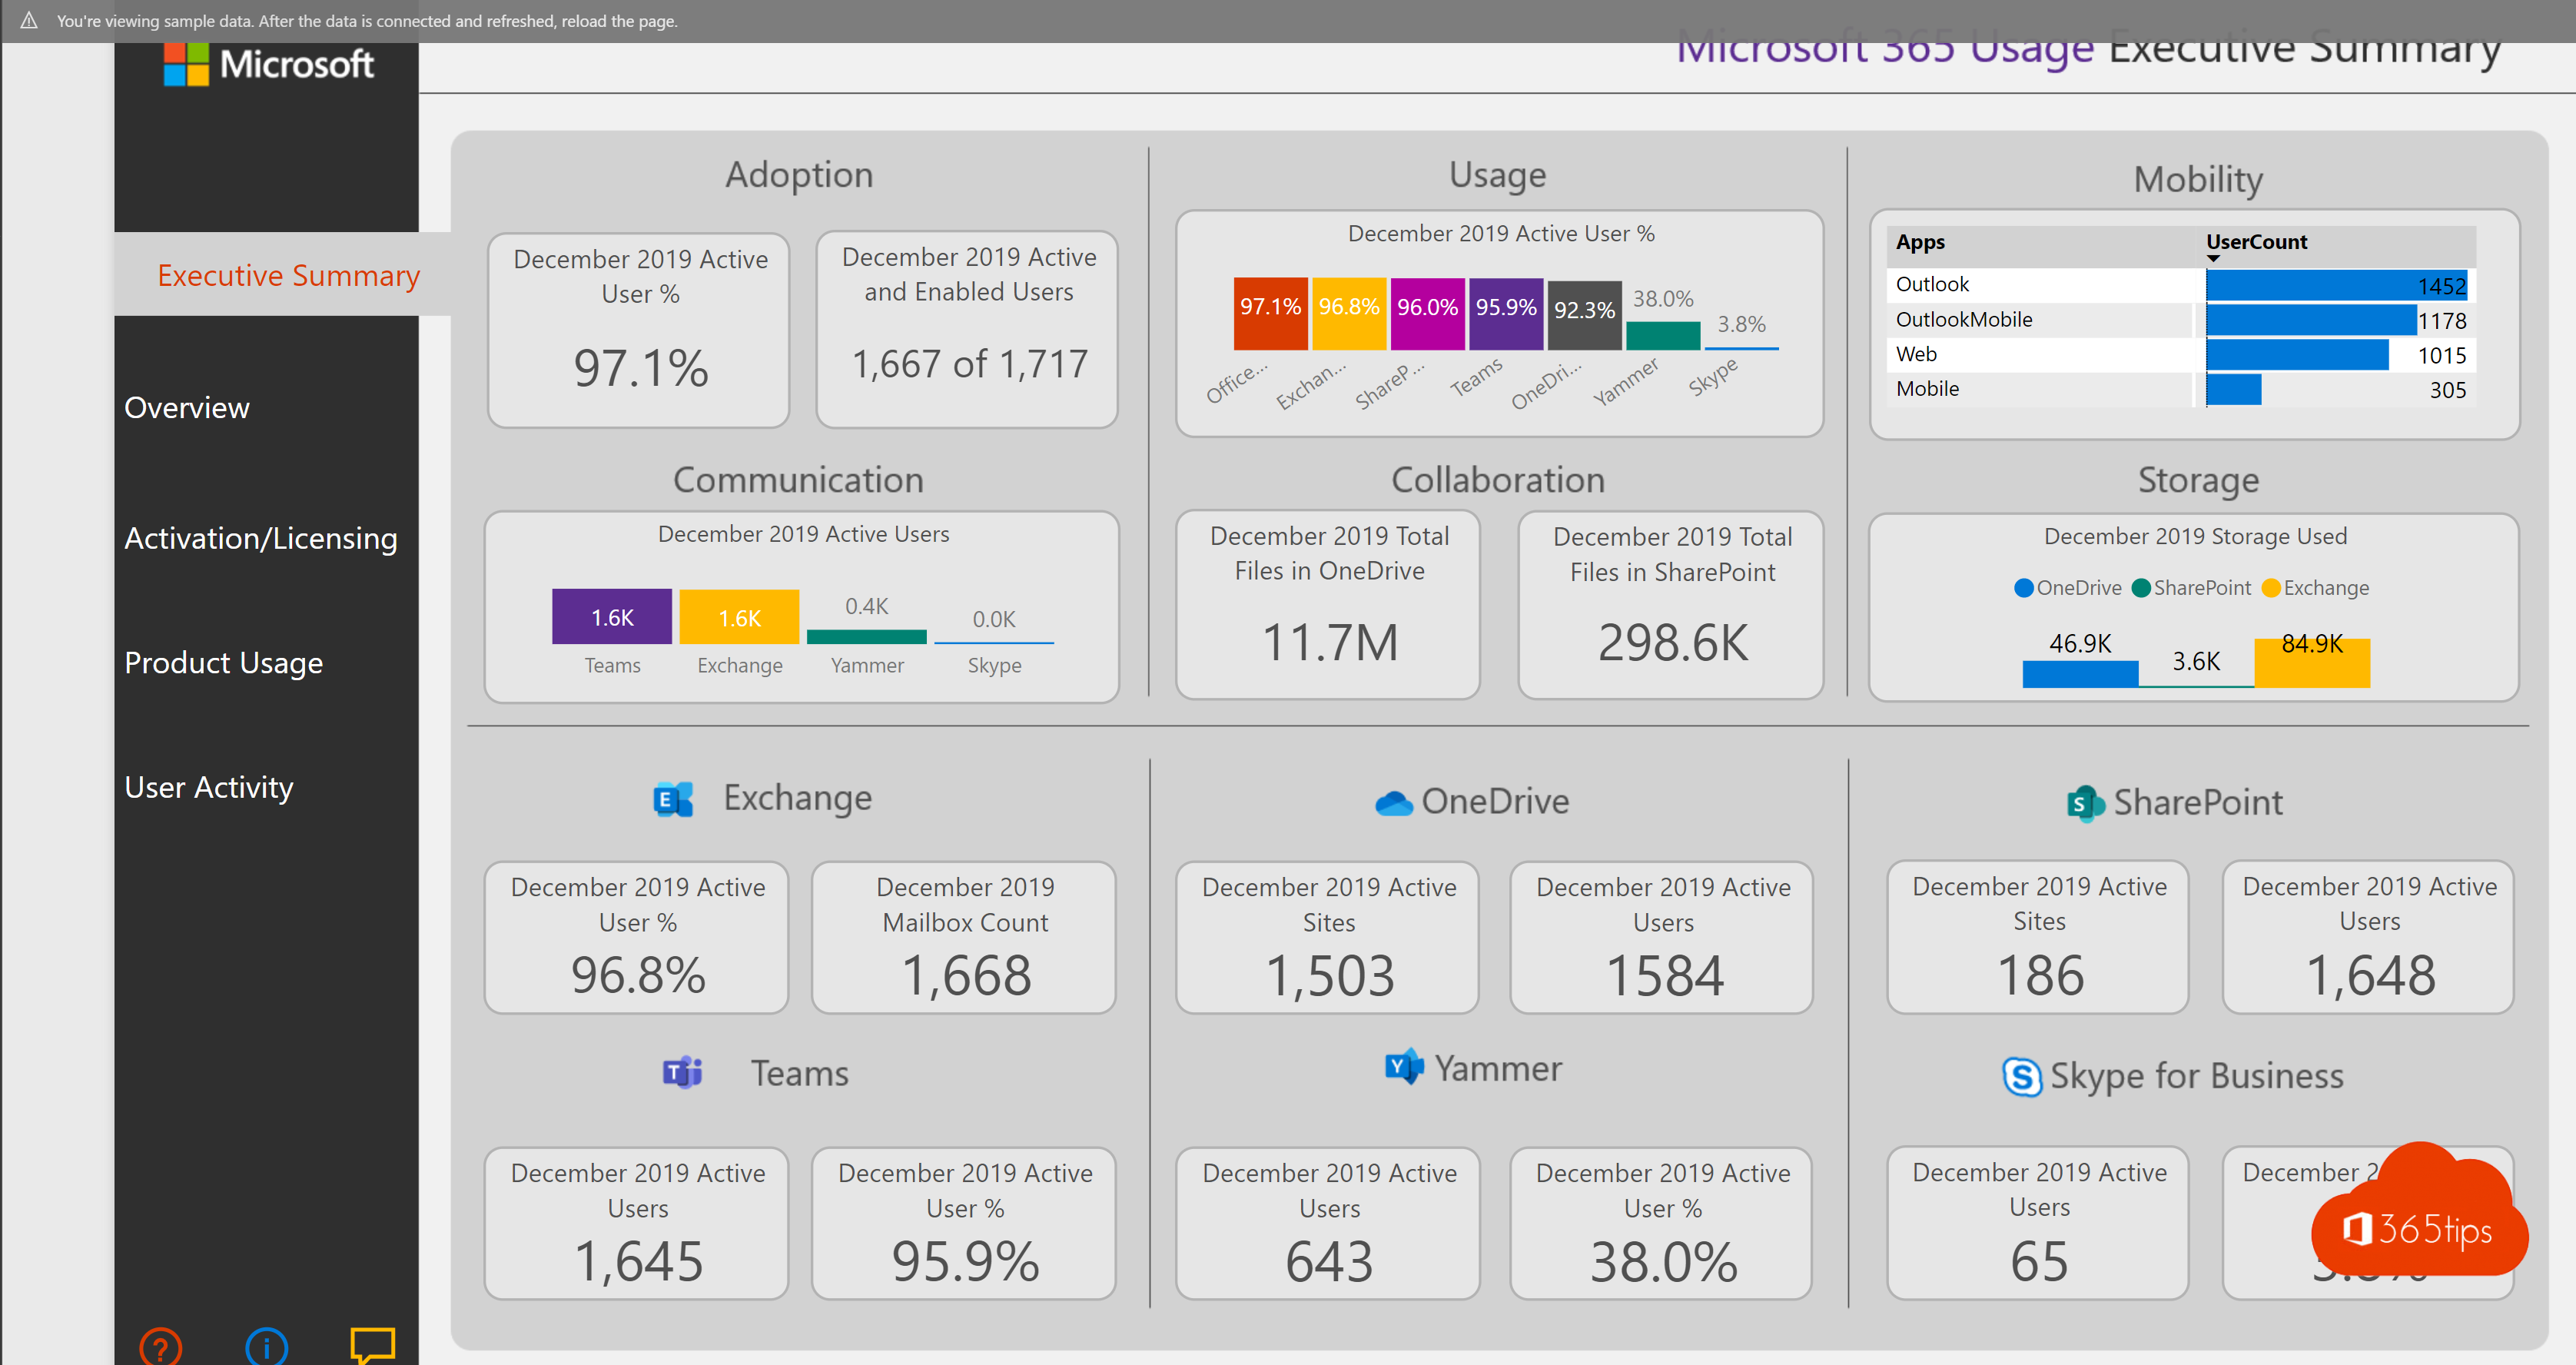
Overview Office 365
- Last month / active use
- Number of Exchange users
- Number of OneDrive users vs. growth
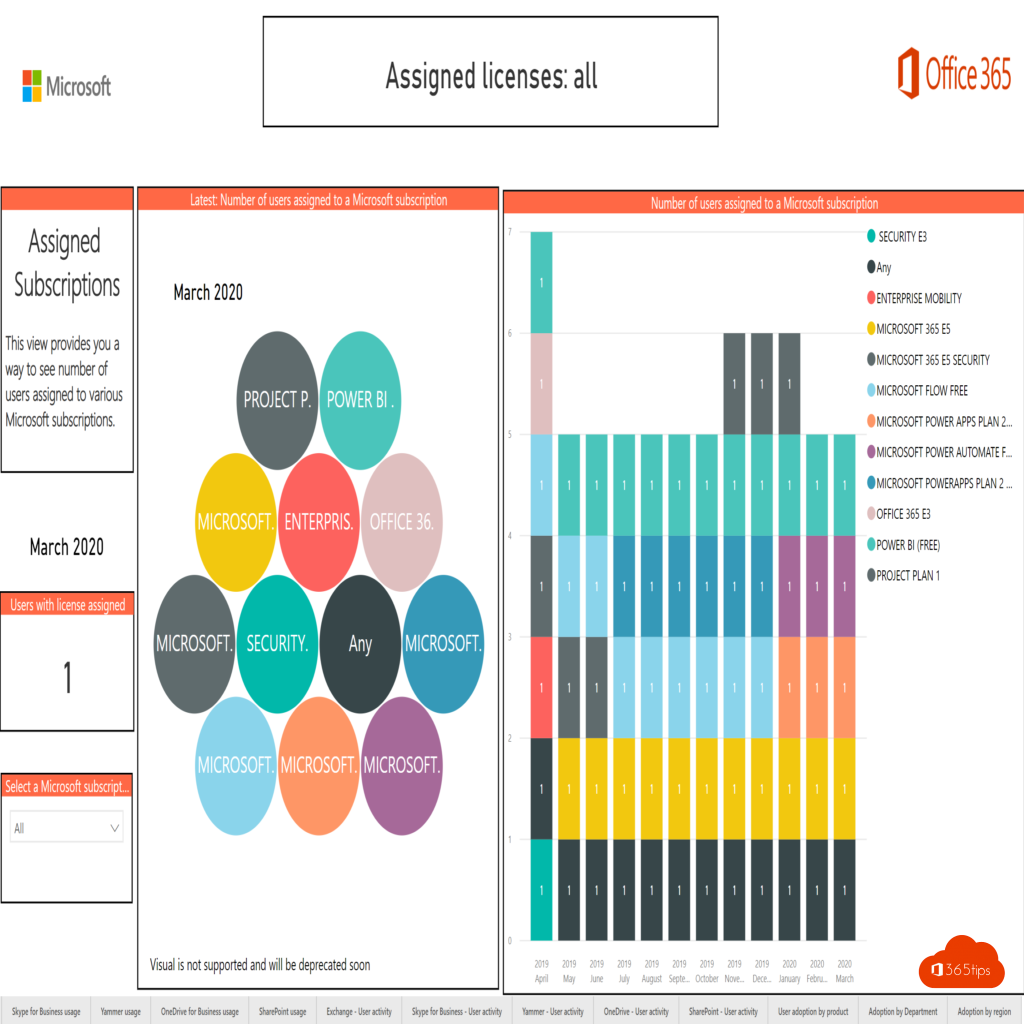
License Assignments
- What users vs. license.
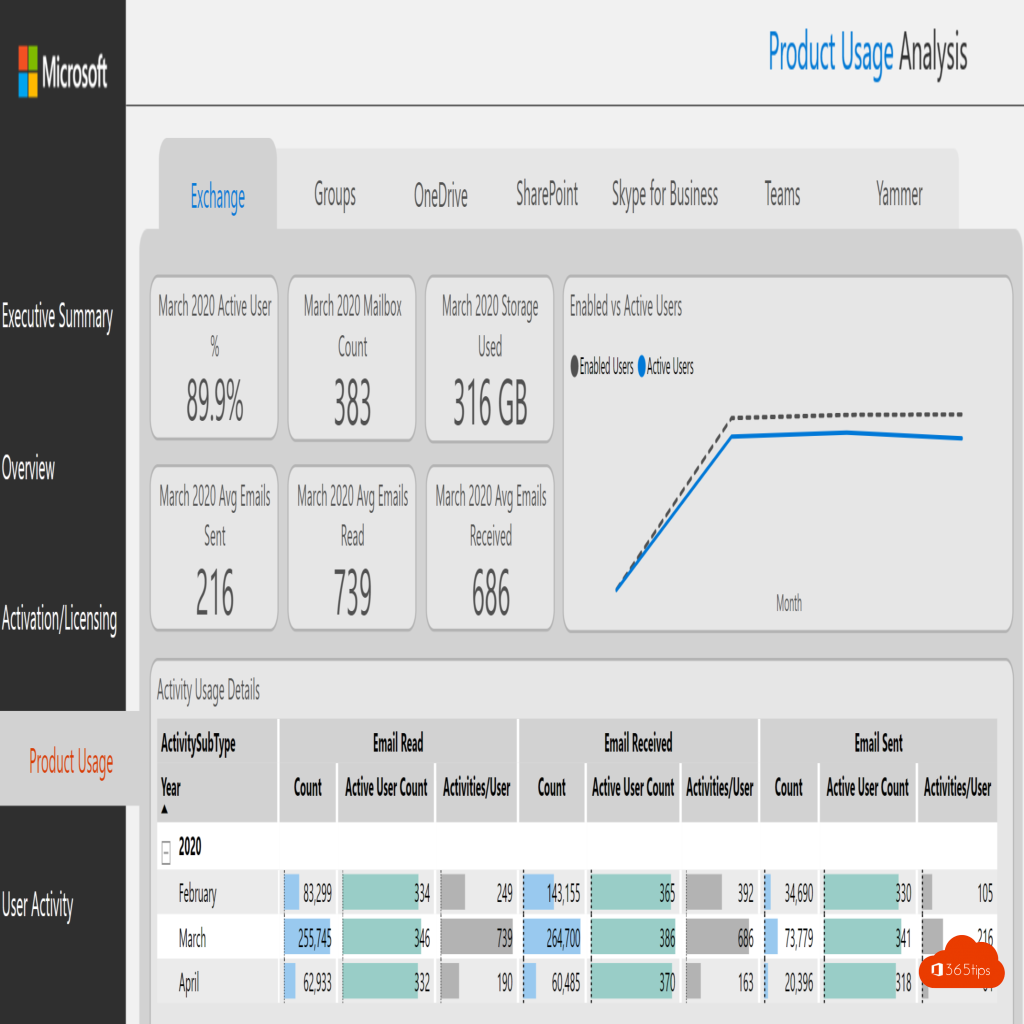
Product usage Exchange
- From this it is possible to measure the trend in Exchange usage in the area.
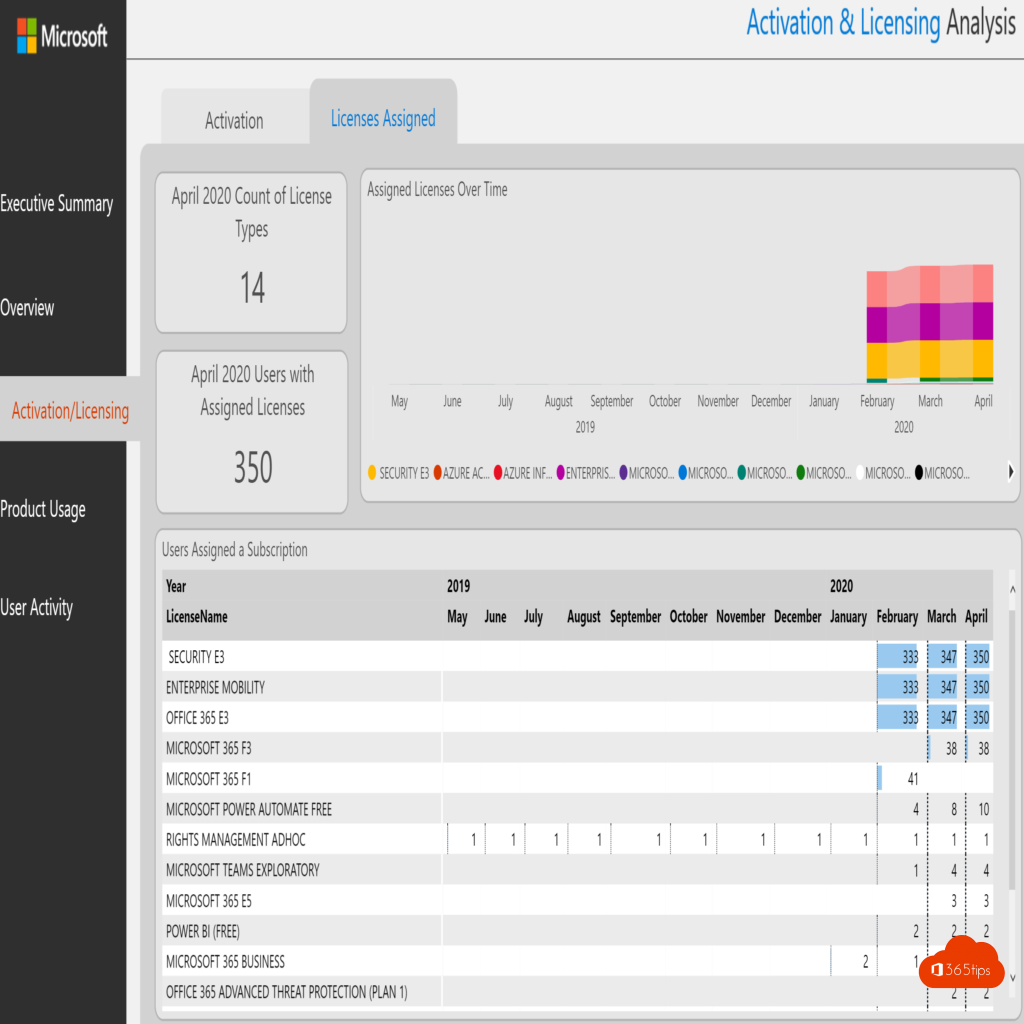
License activation
- License trends can be observed.
- Use of the License & sublicense can also be viewed.
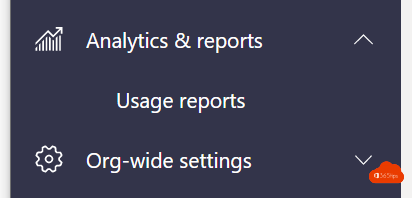
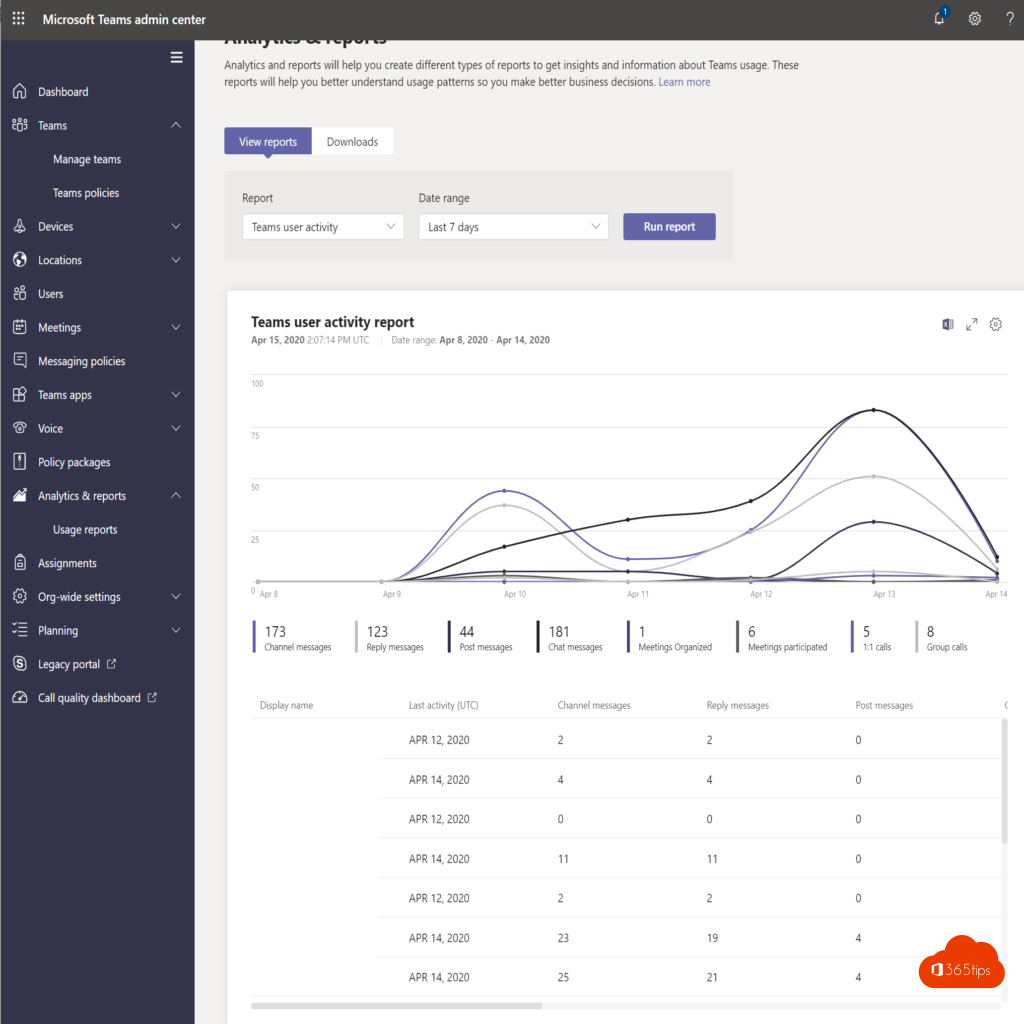
3. Microsoft Teams Activity report in Teams Admin Center
- Accessible through Teams Admin Center https://admin.teams.microsoft.com/dashboard
- Microsoft Teams user activity
- Or Teams device activity
- Teams usage/use
- etc..
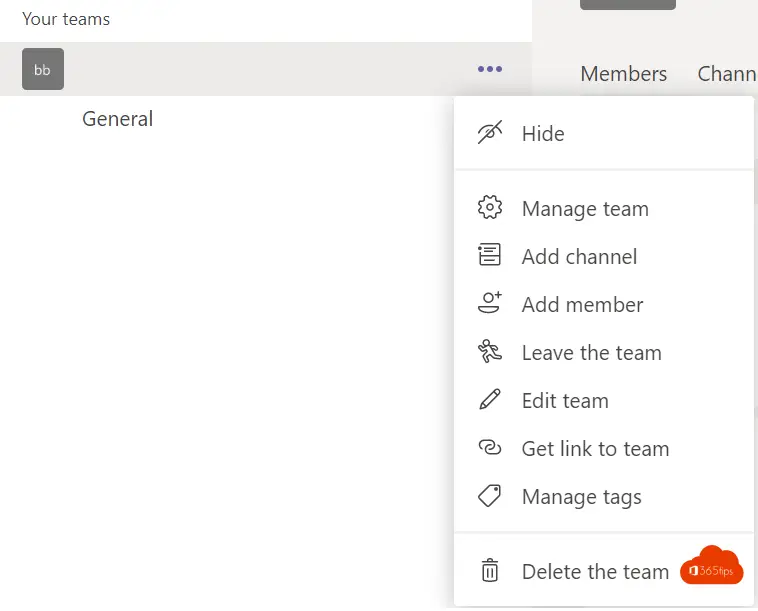
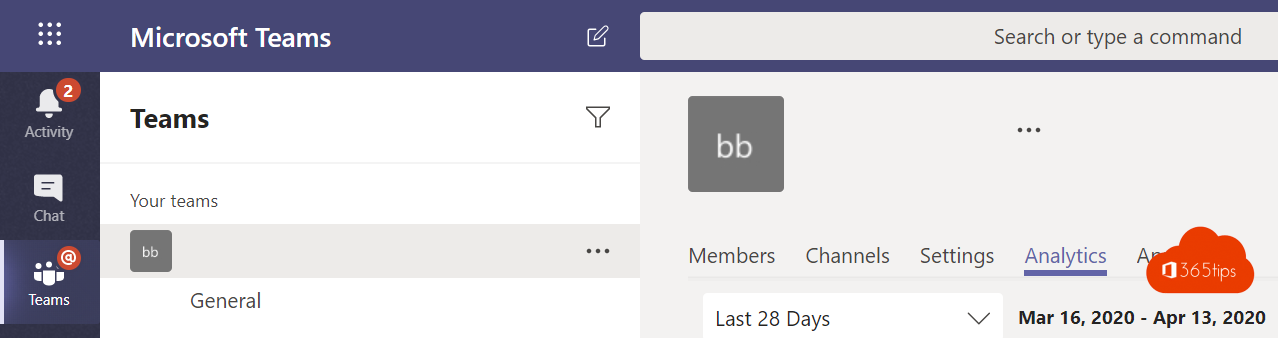
4. Microsoft Teams Analytics Report in Teams
- Analytics can be accessed if you own the Microsoft Teams via.
- Manage Teams
- Analytics
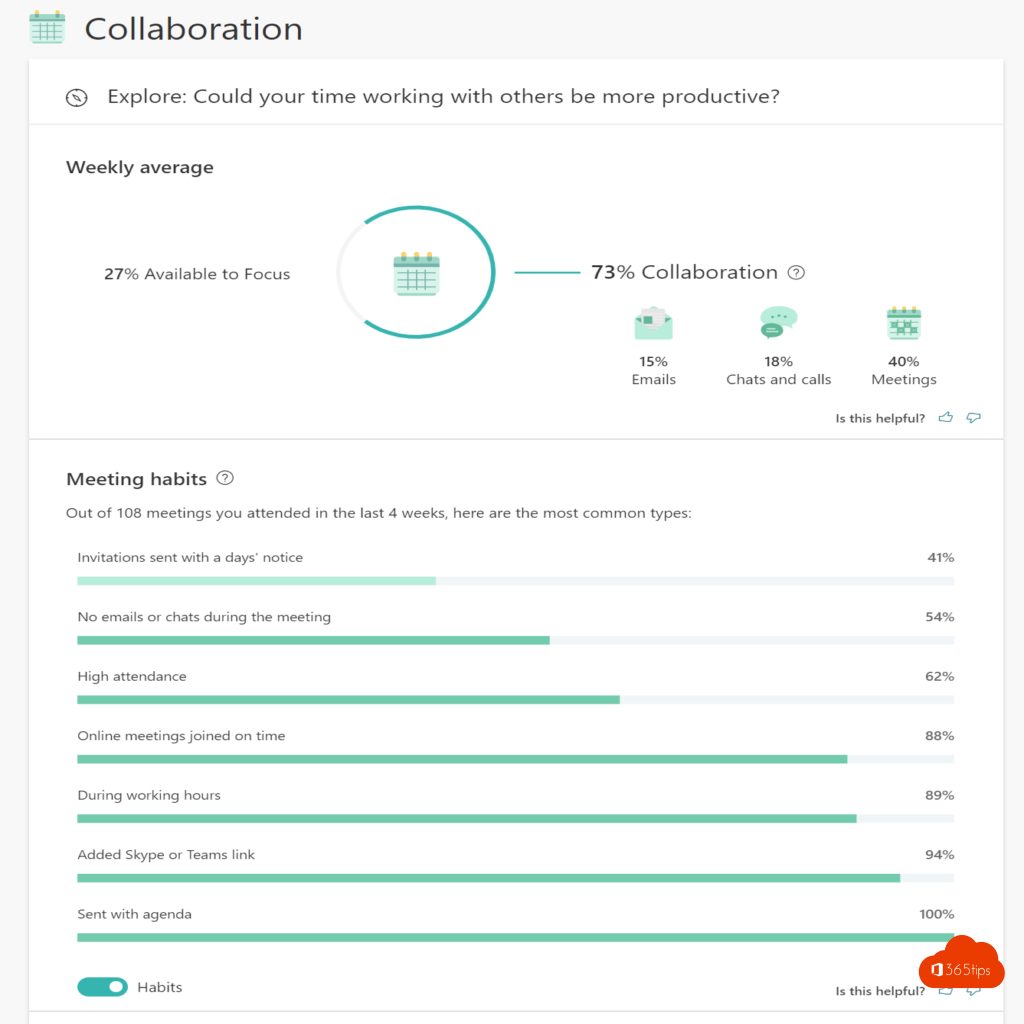
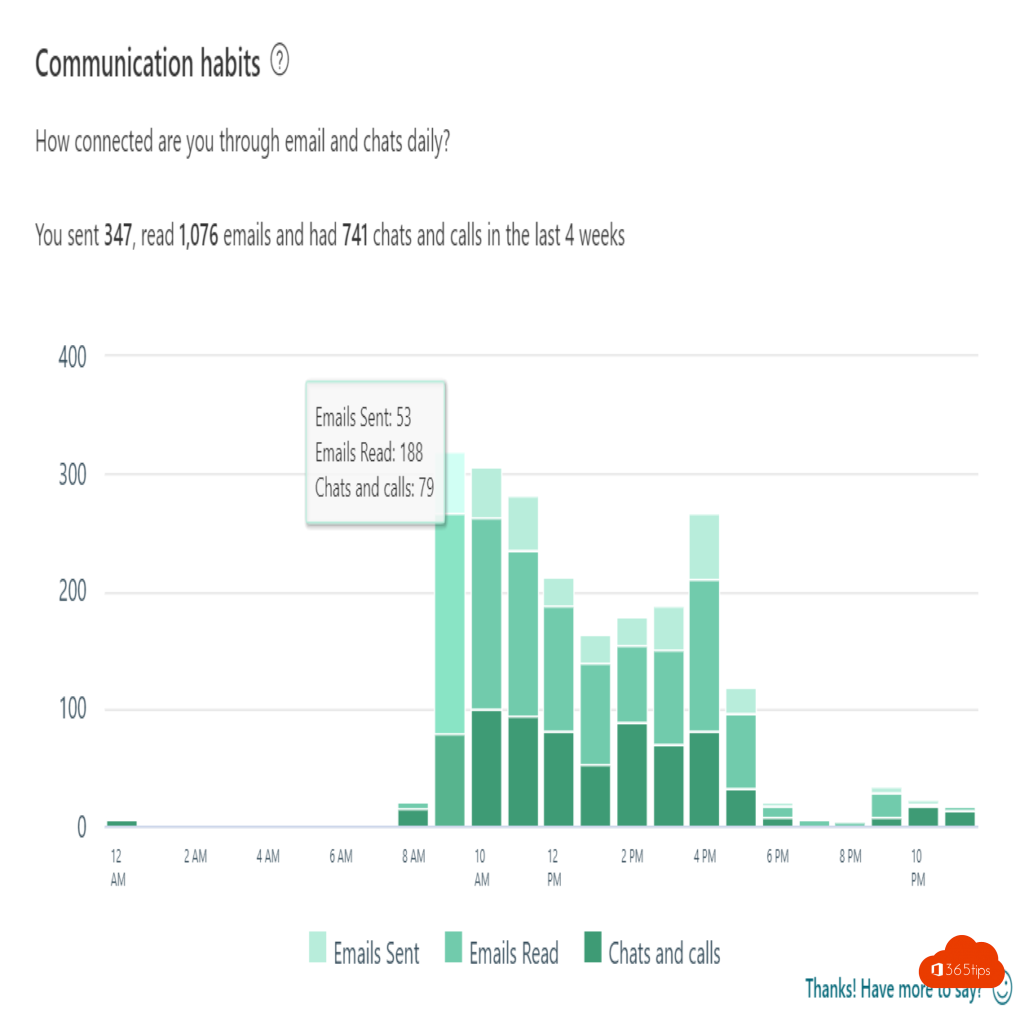
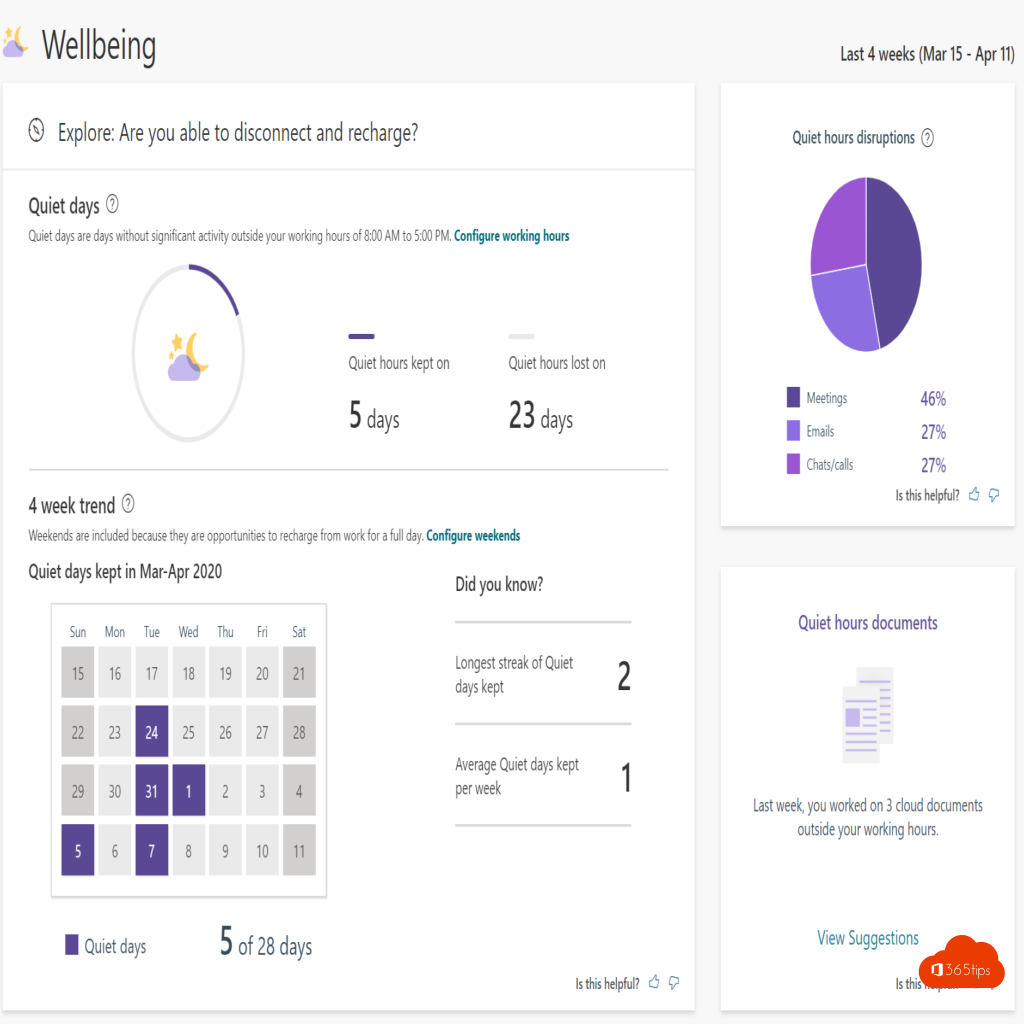
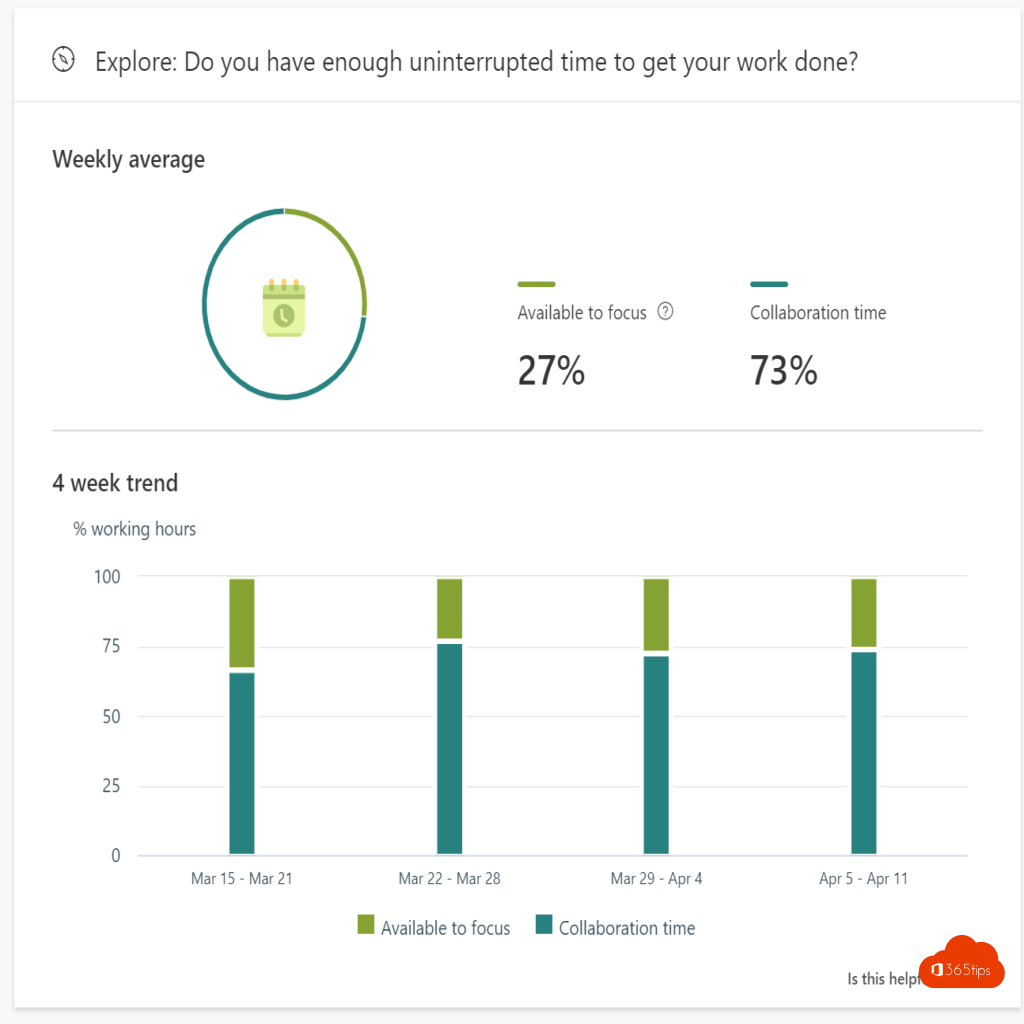
5. Personal productivity with MyAnalytics
Microsoft's MyAnaltics does not quite belong in the list. Nevertheless, I mentioned this because it is important for individuals to be able to observe which tasks they put the most time into. Important for any change is that users are "aware" of their productivity which indirectly affects the overall numbers and facts above.
- You can access this report at: https://myanalytics.microsoft.com/?v=collaboration
- You need an E5 license. You can activate a trial via: this blog.
Collaboration
Communication habits
General health
Focustime!
Summary & Conclusions
- Workplace Analytics, unfortunately, has not yet been released to the masses. It is a promising solution for getting multiple organizational factoring into one view. This is to really actively adjust where there is low usage of services within Microsoft 365. Conversely highlighting where things are going well.
- Office 365 Adoption reports are completely free. And can create many insights that can be managed effectively. If you do a migration to OneDrive and later find that 80% of your users are still working on the file server. Then you can make adjustments thanks to these reports.
- Microsoft Teams Activity reports from the teams administrator panel. This is useful for IT Administrators. Often not much happens with these dashboards because adoption specialists or transformation managers don't get their hands on them.
Microsoft Teams Activity insights connects seamlessly with Microsoft Teams Analytics reports. These are viewable by appointees from Microsoft Teams. - Personal productivity = Awareness of facts such as meeting culture or mail culture = Awareness = the first step.
- It's all about the people. Just because you have nice numbers in dashboards in Office 365 does not mean that goals have necessarily been achieved such as: A better work-life balance. Fewer e-mails, fewer meetings. Getting among the people. Talking, and understanding where technology can help, helps. Not the other way around.
Start with a test setup for Microsoft teams can be done by creating a testtenant.
Also read: activate productivity score.

Thanks for sharing Excellent tips.